Visual Research on the Whiteboard
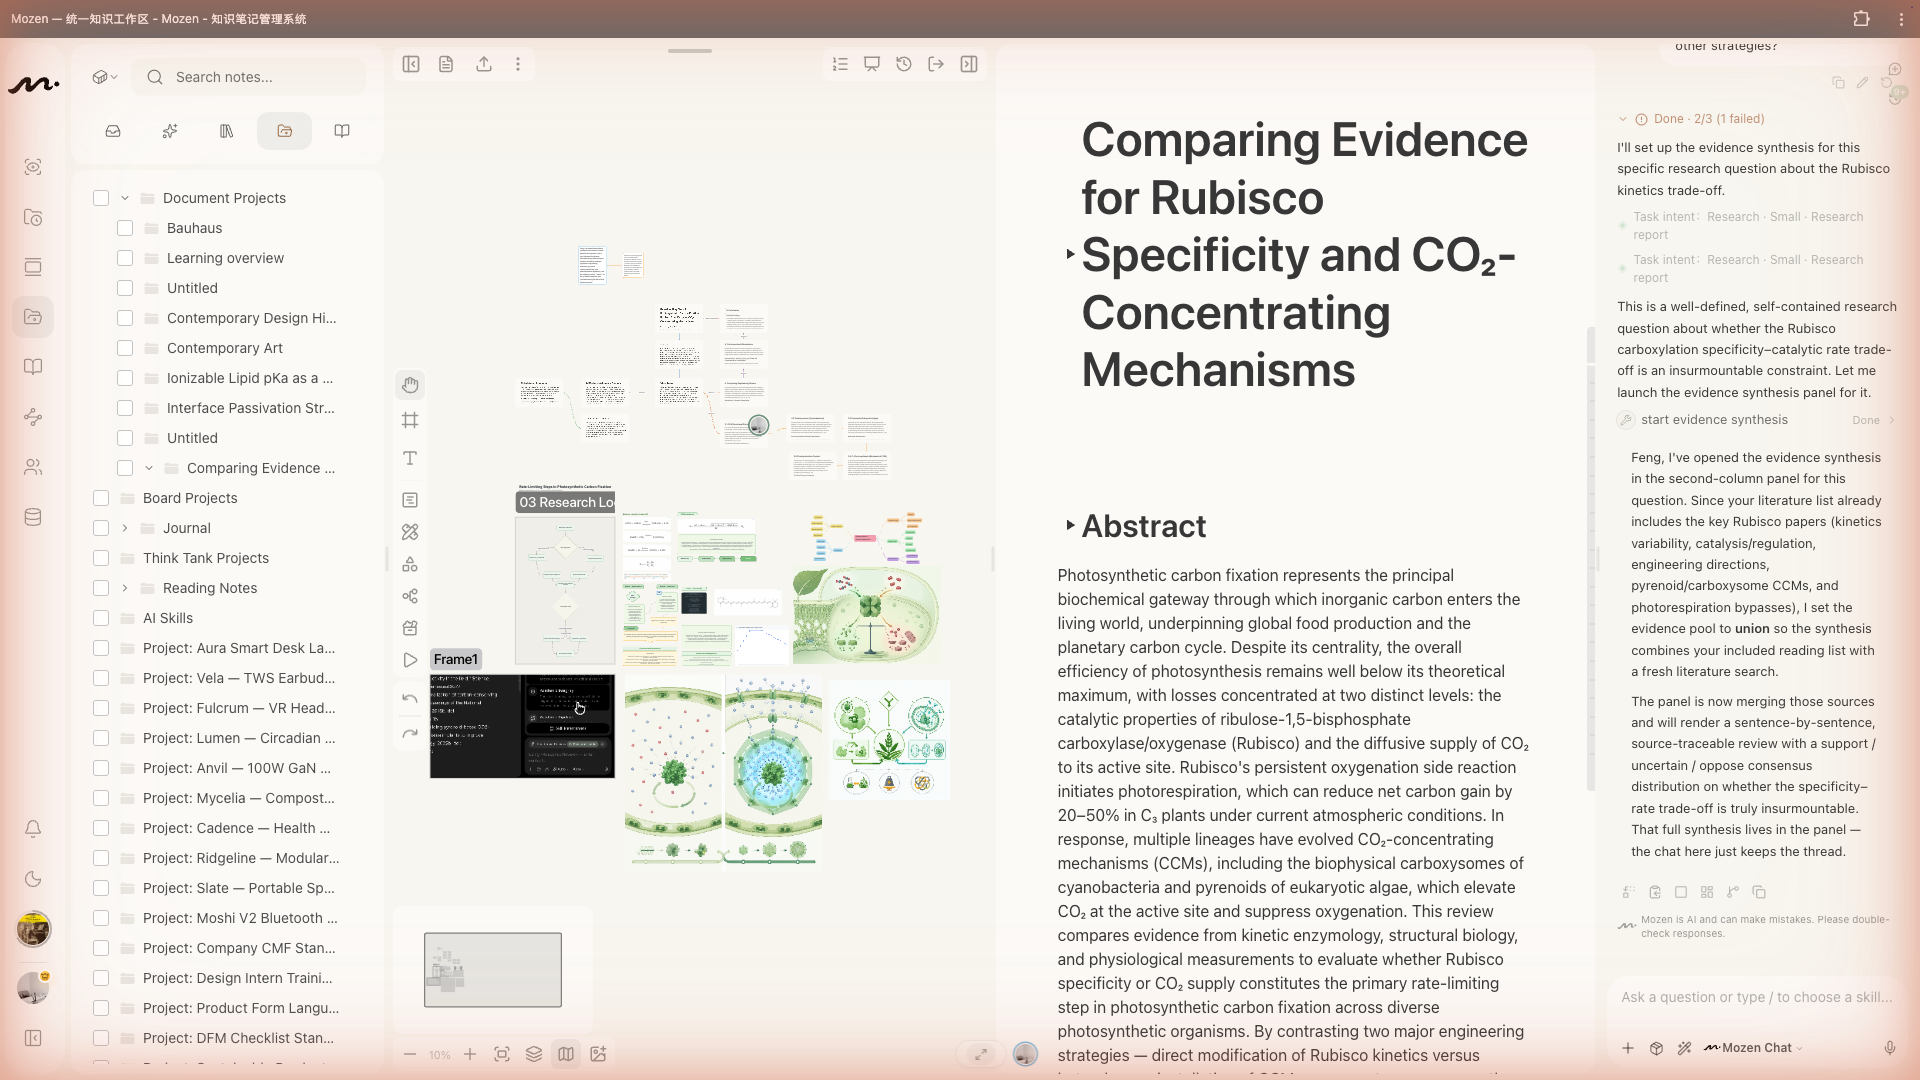
The whiteboard is not a standalone page—it is the second column of a manuscript project. Open a project → enter a manuscript → open or create a draft; the canvas sits in the middle.
It is the natural place for a literature-review matrix: group cards by question, method, finding, or limitation, and put conflicting results next to each other before you write.
Toolbox
The bottom toolbar offers ten tools with shortcuts:
| Shortcut | Tool | Shortcut | Tool |
|---|---|---|---|
| V | Select | H | Pan |
| F | Frame | T | Text |
| N | Card | B | Pen |
| S | Shape | E | Eraser |
| M | Mind map | P | Assets |
Press Esc to return to Select.
Connections
There is no separate connector tool: select an element; small arrows appear on its edges—drag from an arrow to draw a link. Connect shapes, cards, text, or images.
Pull material from the box
In column 1 (tree), select note cards and choose Insert to whiteboard. Arrange them, connect relationships, and frame groups—the skeleton of an article often appears here first.
AI on the canvas
- After selecting shapes or cards, the floating bar can analyze, rewrite, or expand
- AI execution nodes in the toolbox let the model generate content on the canvas
- Image generation places diagrams or mood images into the project
- AI mind maps expand a topic you describe
- AI presentations build slide-like frames on the same canvas
Always check generated text against your literature notes and sources (AI guide).
Working with the editor
Whiteboard (column 2) and editor (column 3) complement each other:
- Spread cards on the whiteboard to see structure
- When section order is clear, insert cards into the editor
- Expand the writing in the editor
- Return to the whiteboard when structure needs another pass
Use ⌘ + 1–6 (Ctrl on Windows) to switch workspace layouts for the column mix you need now.
Presentation mode
Presentation mode steps through framed content like slides. AI-generated decks use this form.
Next steps
- Capture sources with Reading
- Place lasting ideas via Organize
- Move into Academic Mode when the draft must become a cited manuscript